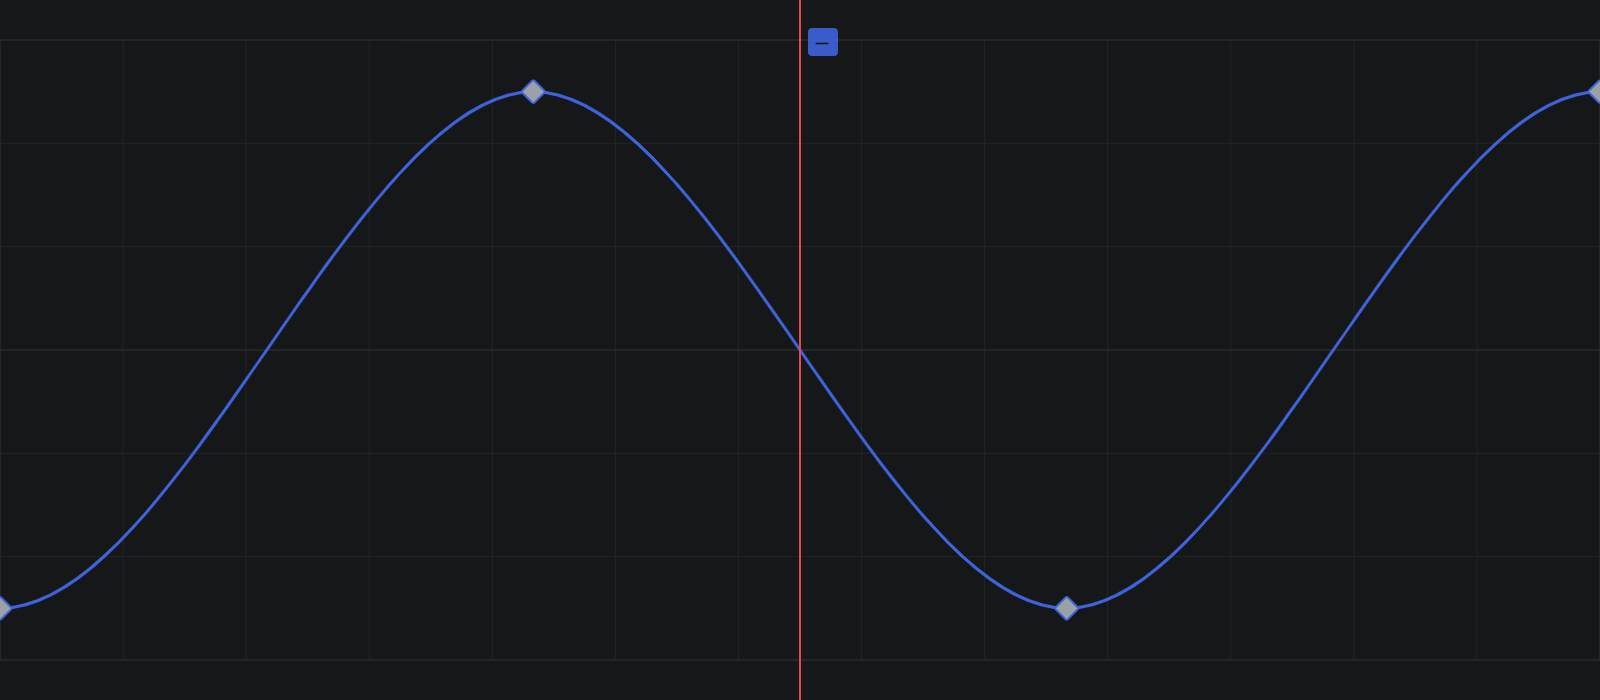
The graph editor is the curve view inside the keyframe panel, to the right of the property list. It plots each visible property's animation as a curve over time, so you can read and shape timing and value with more precision than the property row's keyframe buttons alone. For setting, navigating, and removing keyframes, see Keyframe Animation.
The graph shares its time range with the timeline, so a position in the graph lines up with the same moment in your edit. The playhead (the current-time indicator) is drawn as a vertical line across the curve.
Graph view modes#
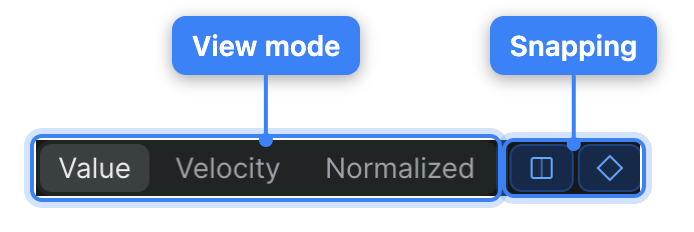
A view selector floats over the top-right corner of the graph. It sets what the curve plots. Click an option to switch:
- Value: Plots each property's actual value over time. This is the default view.
- Velocity: Plots the rate of change — how fast the value is moving rather than what it is. A dashed zero line marks where the value is momentarily still, and the axis is labeled in units per second.
- Normalized: Fits every visible curve to a shared range so properties of different scales can be compared against one another in the same graph.
Snapping#
Two toggle buttons sit to the right of the view selector. Each is an icon button; hover to see its tooltip. Click a button to turn that snap behavior on or off — an active toggle is highlighted. When a drag lands on a snap target, the graph marks it with a highlight ring or a vertical guide.
- Snap to frames: Snaps a dragged keyframe to whole-frame times.
- Snap to keyframes: Snaps a dragged keyframe to align with the playhead or another keyframe's time.
Keyframes and curves#
Each keyframe appears as a diamond on its property's curve, with the curve segments running between them.
- Click a diamond to select it. Shift-click another to extend the selection to it; Cmd-click to toggle a keyframe in or out (Windows: Ctrl-click).
- Drag across empty graph background to marquee-select several keyframes at once. Hold Shift while you drag to add them to the current selection, or Cmd (Windows: Ctrl) to toggle them.
- Drag a diamond to change its time and value. While you drag, a readout near the cursor shows the keyframe's time and value.
- Drag a selected keyframe's tangent handle to reshape the curve entering and leaving that keyframe. For preset curve shapes and easing, see Adjust interpolation.
Tip
Press Esc to cancel a keyframe or handle drag in progress and return it to where it started.
Navigate and edit keyframes#
These shortcuts act on the graph while it has focus:
- Arrow Left / Arrow Right: Move the selection to the previous or next keyframe. This works when exactly one keyframe is selected.
- Arrow Up / Arrow Down: Move the selection to a keyframe above or below the current one.
- Delete or Backspace: Remove the selected keyframes.
The time ruler#
When shown, a time ruler runs across the top of the graph with timecode labels and frame ticks. It reflects the same time range as the graph below it. Click or drag along the ruler to scrub the playhead, or press Arrow Left / Arrow Right to step the playhead one frame at a time.
Property list controls#
The property list runs down the left side of the keyframe panel, one row per animatable property. Besides the value field and keyframe button described in Animate a property with keyframes, each row carries these controls:
- Color swatch: The dot to the left of the property name. It matches that property's curve color in the graph, so you can tell which curve is which when several are plotted at once.
- Toggle visibility: The eye button on the row hides the property's curve from the graph. Click it to hide the curve, and click again to show it. Hiding a curve changes only what the graph plots — it does not affect the animation, playback, or output. The button's tooltip reads Toggle visibility.
- fx: The
fxbutton opens the expression editor for the property. See Drive properties with expressions.

Note
An animated property can also be driven by an expression instead of hand-placed keyframes. See Expressions.